Executive summary
Eixos visited, classified and geolocated every single retail store in Manhattan during the second quarter of 2019.
This report, which takes into account all 31,362 retail spaces in Manhattan, analyzes several aspects of retail in the borough:
– The distribution of economic activity by sectors of commercial activity
– The health of the retail throughout the borough, including unmet needs and the actions required to preserve and boost the commercial ecosystem
– The existence of concentrations of Commercial Attraction / Destination Retail areas at the street level, in the form of a ranking according to the Destination Retail Index (DRI).
– The location of concentrations of retail stores with stronger specialization, also known as clusters.
This Executive Summary summarizes the main conclusions from the report.
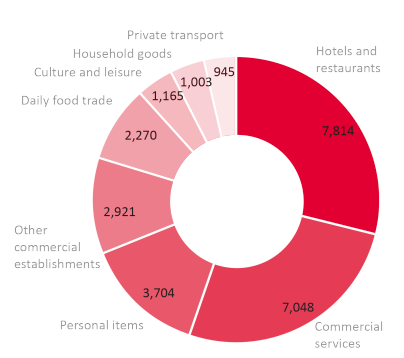
Sectors of retail activity.
One third of Manhattan’s retail stores are dedicated to Hotels & Restaurants (29.08%), more than a quarter (26.23%) to Commercial Services (hairdressing salons, beauty parlors, financial services, travel agencies and professional services in general), almost 14% are selling Personal Items (clothes and accessories, shoes, jewelry) and less than 9% in the Daily Food Trade. Culture & Leisure occupy 4.34% and Household goods almost 4%. The rest is distributed across services, including Private Transport and Other Commercial Activities.
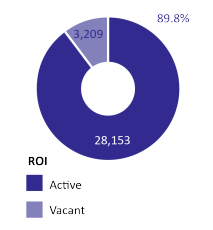
Retail Health. Occupancy.
The average occupancy of retail stores in Manhattan, measured according to the Retail Occupancy Index, is 89.8% (ROI 89.8). This indicates that, on average, Manhattan clears the threshold for very good occupation (ROI > 90).
Several individual neighborhoods (this report uses NYC´s Neighborhood Tabulation Areas or NTAs) have a very good or excellent occupancy, such as Soho-TriBeCa-Civic Center-Little Italy (ROI 94.65), Upper East Side-Carnegie Hill (ROI 93.05) and Midtown-Midtown South (ROI 90 , 07).
There are nine neighborhoods with a good (ROI > 85) or satisfactory occupancy (ROI > 80), such as Central Harlem South (ROI 89.9) or East Village (ROI 83.29).
It is necessary, however, to monitor occupancy in certain areas that show some early signs of desertification (ROI < 80), such as Central Harlem North-Polo Grounds (ROI 80.30), Hamilton Heights (ROI 79.90 ), Manhattanville (80.67), Chinatown (ROI 80.96) and, to some degree, the Lower East Side (ROI 81.53).
Retail Health. Commercial attraction / Destination retail areas.
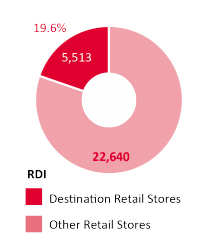
The Destination Retail Index, which measures the percentage of all retail stores that are in the categories of Personal Items, Household Goods, and Culture & Leisure, is 19.6% for the borough of Manhattan as a whole (DRI = 19.6).
A DRI of less than 20 indicates that the area, since it does not have these destination types stores, exhibit leakage of consumers to other areas that have more of these types of attraction-oriented stores. The DRI for Manhattan as a whole indicates that there are many neighborhoods in Manhattan that have a small percentage of these type of attraction-oriented stores.
The districts with excellent retail attraction are the neighborhoods (NTAs) of Upper East Side-Carnegie Hill (DRI 40.17) and SoHo-TriBeCa-Civic Center-Little Italy (DRI 37.92).
There are other neighborhoods with a powerful retail mix that, while not as strong as the aforementioned neighborhoods, do not suffer from consumer leakage. These include Hudson Yards-Chelsea-Flatiron-Union Square (DRI 25.26) and West Village (DRI 22.96).
Of the 28 neighborhoods in Manhattan, 22 have a DRI of less than the threshold of 20, indicating that they do not have a attraction-oriented commercial mix. As a result, these 22 districts have retail leakage to the strongest neighborhoods (DRI > 30) and to the neighborhoods with a balanced commercial mix ( DRI > 20).
Top 10 of commercial streets by commercial attraction / Destination Retail Index.
The Destination Retail Index (DRI) is also used to identify the most commercial attractive streets in Manhattan; these are the streets that have the highest percentage of destination retail.
Using this ranking system, Greene Street in Soho is the number one street (DRI 84.15).
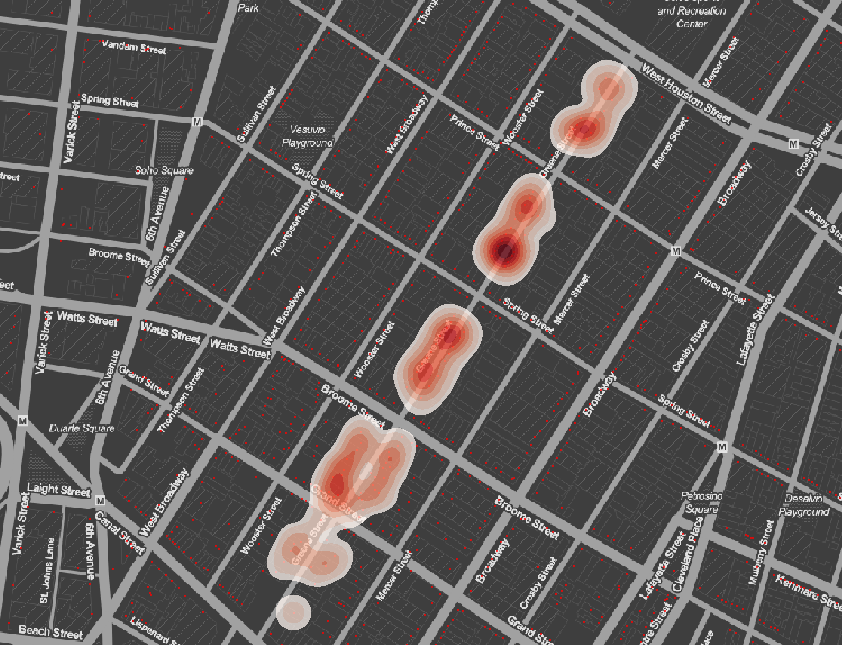
Image: Greene St. DRI heat map.
In fact, SoHo’s streets occupy five of the Top 10 positions: Wooster St (# 2), Mercer St (# 3), Prince St (# 4), Spring St (# 9).
Midtown streets also occupied a large share of the top 10. This includes West 47th Street (#5), largely due to the high concentration of jewelry stores in the Diamond District, as well as West 34th Street (# 6) and West 30th Street (# 8).
Two of the most famous shopping areas in Manhattan rounded out the top 10, with Madison Avenue (#7) and 5th Avenue(# 10).
Retail Health. Retail Density.
According to the Retail Density Index (RDI), Mitdtown-Midtown South is the best served neighborhood (NTA), with almost 11 retail stores per 100 inhabitants (RDI 10.83), followed by SoHo-TriBeCa-Civic Center-Little Italy (RDI 5.52).
There are four more neighborhoods with an RDI greater than 2.5, which indicates a sufficient supply of attraction retail.
However, the remaining 22 neighborhoods have a residential area level of service (an RDI between 1 and 2.5) or even less (RDI < 1).
Retail Health. Scenarios.
Next we look at the overall commercial health of a neighborhood. This requires looking at the combination of the three commercial indicators (ROI, DRI, and RDI) and establishing “health scenarios”. Each of our health scenarios has different thresholds for each of these three commercial indicators. By classifying each neighborhood into these “health scenarios”, it becomes more clear which neighborhoods are the highest and lowest performing across all 3 indicators.
There are 5 health scenarios. They range from a high performance scenario (SoHo-TriBeCa-Civic Center-Little Italy) to intermediate stages with no health problems (such as West Village), to scenarios with serious retail health problems (such Lower East Side or Morningside Heights). Please see the complete report for the ranking of all neighborhoods of Manhattan.
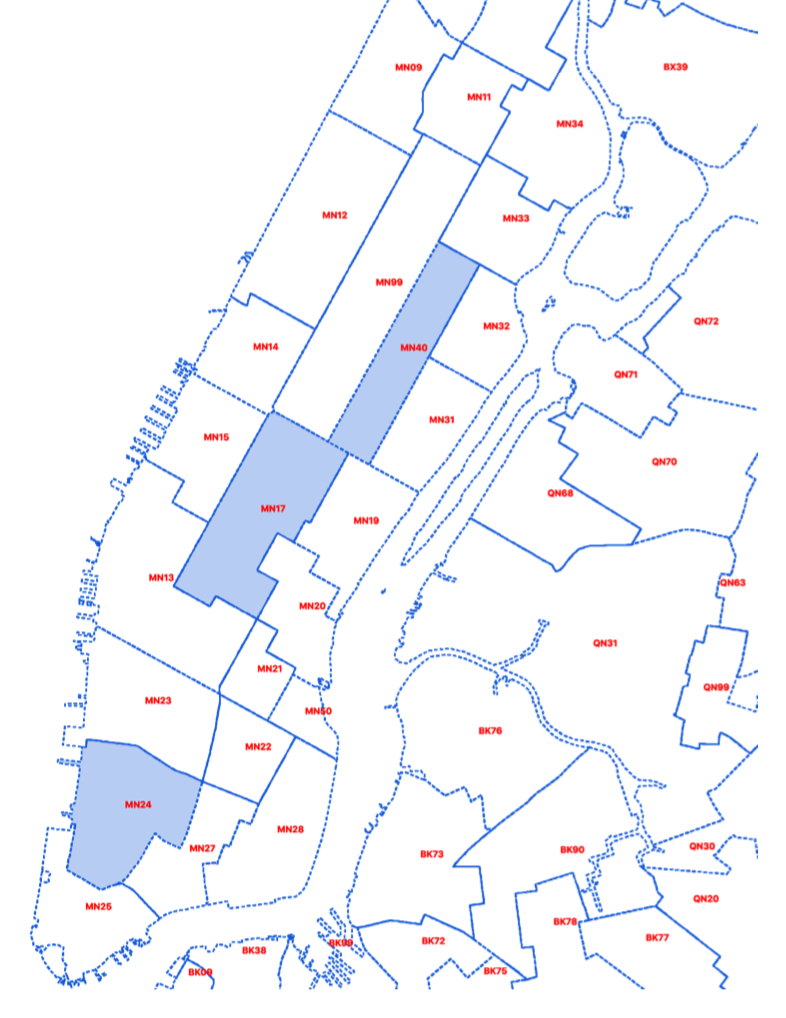
Image:
Map of High performance Neighborhoods in Manhattan.
Detection of economic activity clusters.
Finally, the report analyzes the presence of concentrations of specialized retail stores. The following are a few examples.
Daily food trade.
The largest concentration of specialized food shops is found in Chinatown, in the area that goes from Grand Street and East Broadway to Essex Street (near the Lower East Side). Here the Essex Market plays a large role in the diversity of food stores in this Neighborhood Tabulation Area (NTA), as do all the small food shops that are typical of Chinatown.
We also find concentrations of food specialized shops in the broader Harlem area, and in the vicinity of St. Nicholas Avenue, between Washington Heights North and Washington Heights South.
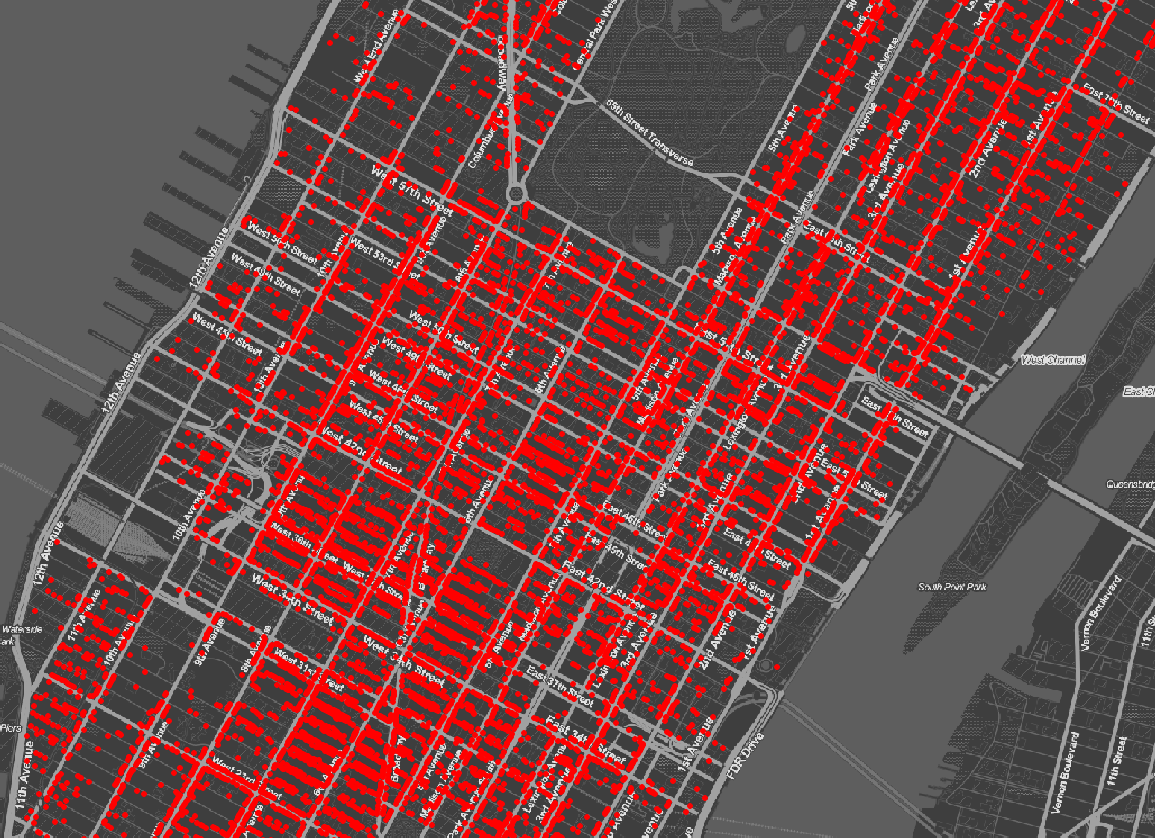
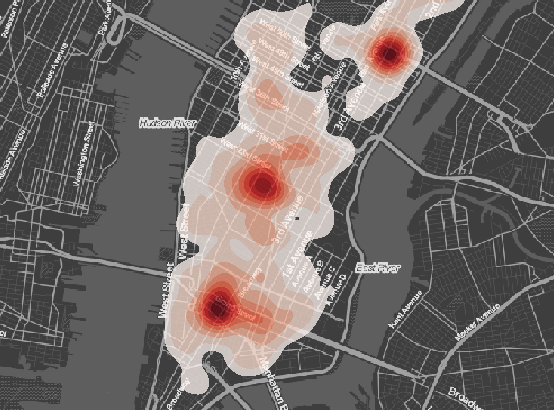
Personal Items.
The greatest concentration of this type of retail store is found in SoHo. We also find concentrations of lesser intensity in the Midtown East and Midtown South, and also in the Upper East Side.
Heat map for shops selling Personal Items.
Household goods.
We find areas of concentration in SoHo, southeast of Hudson Yards-Chelsea-Flatiron-Union Square, and east of Third Avenue south of East 59th Street.
Heat map for shops selling Household goods.
Detection of consumer clusters.
The report also analyzes the concentration of activities from the point of view of consumers with specific profiles. The following is one example.
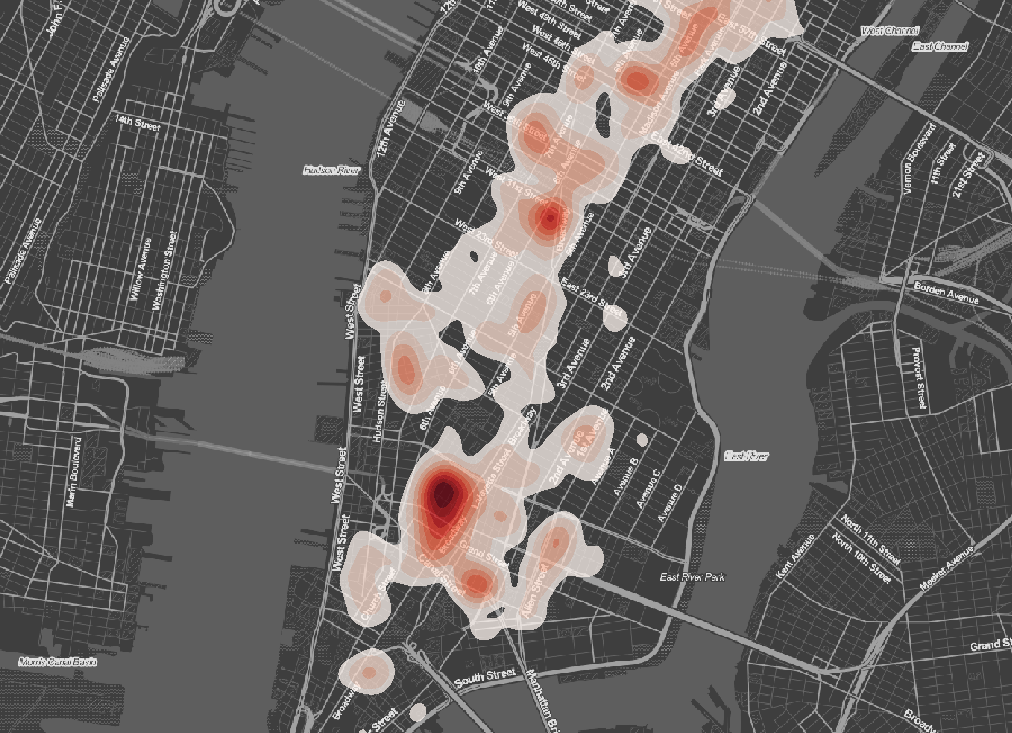
Cluster: “I’m not cooking at all”.
This consumer profile makes intensive use of restaurants and prepared food services, and not so much the food retail stores where you would by basic ingredients for cooking. This cluster could also be called Food as a Service (FaaS).
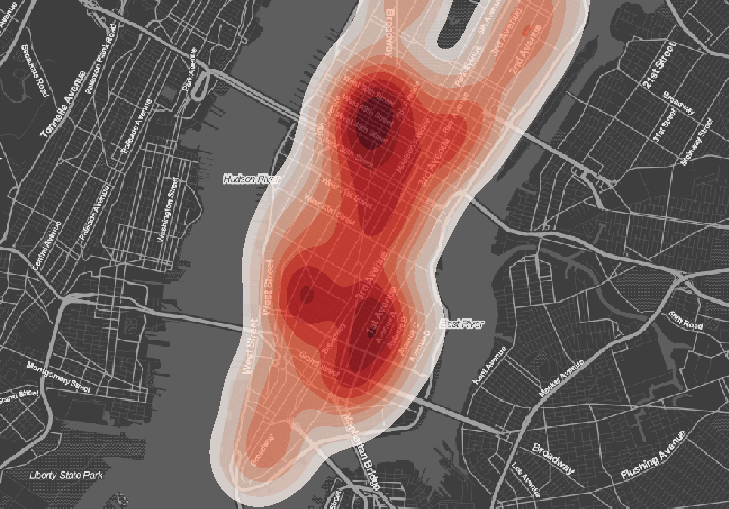
In the southern half of Manhattan, south of Central Park, we find a continuous carpet of restaurants. These restaurants most likely have as their main clients all the workers and tourists who visit the area every day, and to a lesser degree residents of the area.
Heat map for “I’m not cooking at all” cluster.
All these clusters or concentrations of specialized stores create micro-systems within the general retail ecosystem of Manhattan. By identifying these clusters, they can be preserved and even fostered. Clusters are also a source of opportunity; they promote retail specialization and qualification and, at the same time, they attract new talent that adds value to the retail ecosystem.
Data Sources.
Data sources that have been used to prepare this report:
Retail Data: EIXOS Economic Observatory
Population Data & Administrative Boundaries: Open Data NYC
Cartography Base: Open Street Map